Home
Portfolio
Company
Contact
 PinWheel Analytics
Ongoing
E-commerce & Retail
North America


Pinwheel Analytics is a consumer tech company that offers eCommerce products through platforms like Amazon, Stripe, and custom online stores. Focused on subscription-based revenue, Pinwheel needed better visibility into customer behavior, product performance, and churn trends to support growth and retention strategies across regions.
End-to-end Data Engineering
ETL and Data Modeling
Business Intelligence Implementation
Subscription Commerce and Marketing Analytics
Data Engineering Specialists
BI Developers
Marketing Analytics Consultants
ETL & dbt Modelers
Offshore Hiring
Eliminating Data Gaps, Inefficient Reporting, and Weak Customer Understanding
.png)
Payment, sales, and engagement data existed in unconnected, inconsistent systems.

KPIs were compiled ad hoc, limiting speed and accuracy of business decisions.

No ability to measure churn, LTV, or user behavior across cohorts.
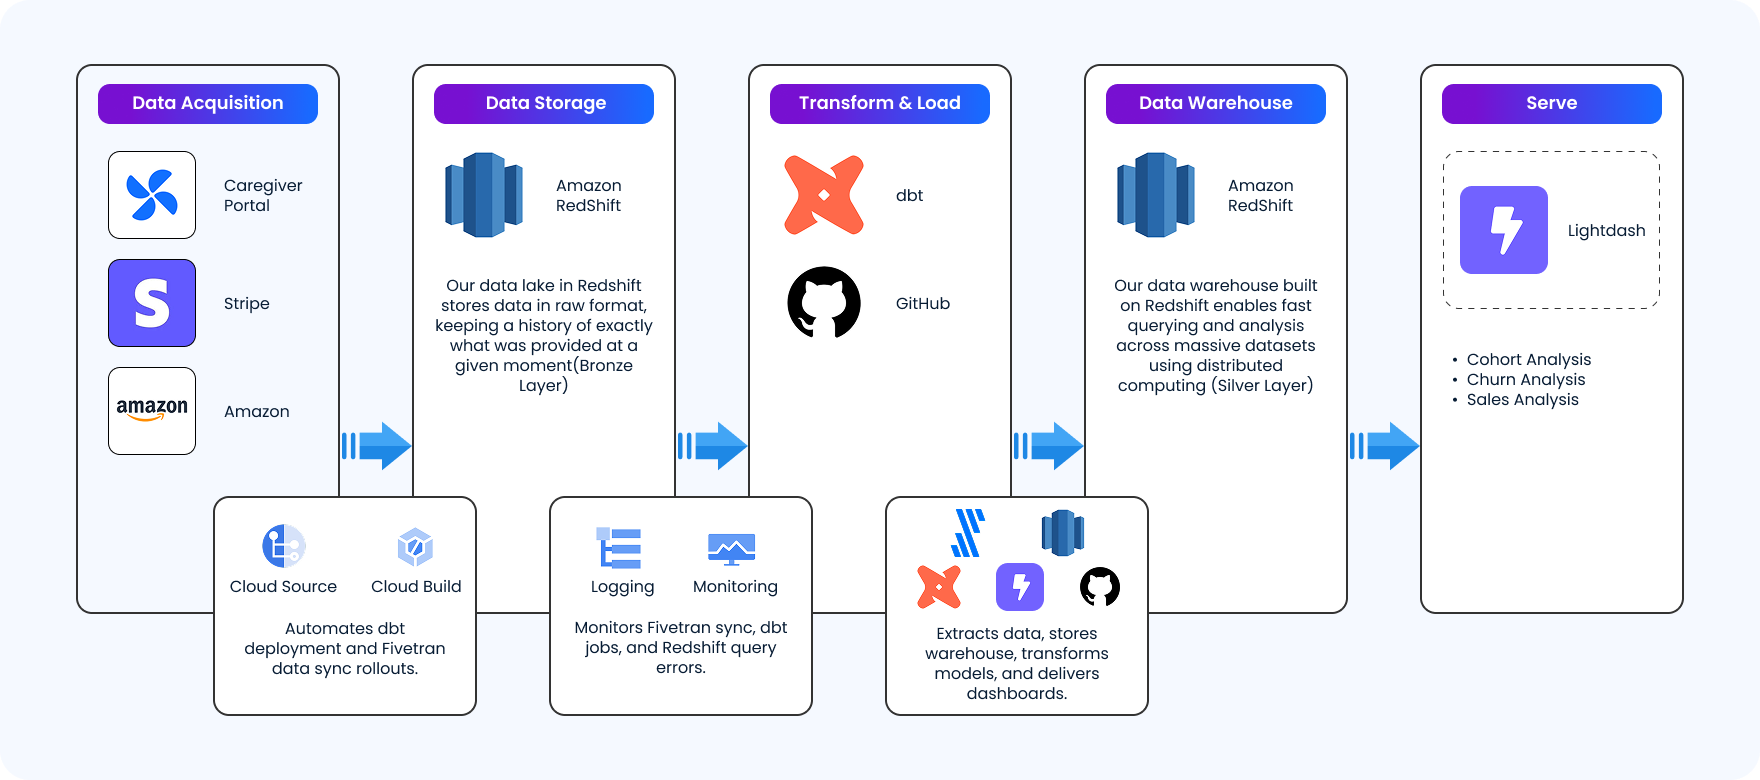
The team architected a scalable analytics pipeline with Amazon Redshift at its core. Fivetran was deployed to ingest raw data from Stripe, Amazon, and e-commerce platforms. dbt was used to transform these disparate datasets into clean, analysis-ready tables. A semantic layer was built on top to standardize KPIs and empower self-serve reporting via Lightdash.
Custom dashboards were developed to address the most critical questions facing the business:
● How’s the churn rate trending by cohort, region, and product line?
● How are attach rates evolving across cellular product bundles?
● Where are drop-offs happening within the user funnel?
● How does mobile app engagement influence repeat purchases?
Each dashboard was designed for business users—simple to navigate, aligned with strategy, and refreshable in near real time.
Unified Data Modeling and Dashboarding for Scalable, Consistent Insights Delivery
Using modular dbt models, the team stitched together data from all core platforms into a unified data model. This model powered a semantic layer that ensured metric consistency across departments, reducing reporting conflicts and unlocking faster iteration cycles.
Interactive dashboards were launched via Lightdash, tailored to specific teams: churn and cohort views for retention teams, attach rate and sales performance for product teams, and acquisition metrics for marketing. Stakeholders no longer had to wait for ad hoc reports—insights were available on-demand, at their fingertips.
The result was a powerful data ecosystem built for scale, accuracy, and decision velocity.

.png)
.png)

faster dashboard build time

team-wide reporting access
improvement in retention
automation of key KPIs
DataRopes.ai is a global technology partner which delivers end to end services like data engineering, data analysis, data science and AI & ML
Reviewed on


150 E B St Lbby # 1810

1106 A, 11th floor, Haly Tower,
Sector R DHA Phase 2, Lahore
DataRopes.ai is a global technology partner which delivers end to end services like data engineering, data analysis, data science and AI & ML.
Reviewed on
Address
150 E B St Lbby # 1810
1106 A, 11th floor, Haly Tower,
Sector R DHA Phase 2, Lahore
© DataRopes 2025. All rights reserved


.png)

.png)