Home
Portfolio
Company
Contact
 Sunrise
6 months
Telecommunications
Switzerland


.png)

The client is a leading telecommunications provider in Switzerland offering broadband, mobile, and digital solutions. They have recently adopted Google Cloud for analytics and performance monitoring and sought to build scalable, dynamic pipelines to centralize insights across web and operational platforms.
Automated Lighthouse reports with real-time dashboards
End-to-end GCP pipeline for performance metrics Centralized reporting for all client properties
Reduced manual work via scheduled transformations
Data Engineer
Cloud Architect
BI Developer
Technical Project Manager
Contractual hiring
Eliminating Data Gaps, Inefficient Reporting, and Weak Customer Understanding

Needed a seamless way to ingest data from various internal systems and APIs
.png)
No centralized dashboard to track website performance metrics across regions

Time-intensive workflows and fragmented cost/performance analysis
To improve visibility and efficiency, we must automate data pipelines across internal services and third-party APIs, reducing manual effort and delays. Integrating Lighthouse data into a real-time analytics workflow will enable continuous monitoring of web performance. Understanding the metrics that matter most to digital and business teams—such as cost, speed, and uptime—allows us to build unified dashboards that support data-driven decisions and scalable, cross-functional performance management.
● How do we automate data pipelines across all services and APIs?
● Can Lighthouse data be embedded into a real-time analytics workflow?
● What visibility do digital teams need to improve cost-efficiency?
● How do we empower business teams with unified dashboards?
Scalable, Automated Infrastructure for Web Performance Analytics
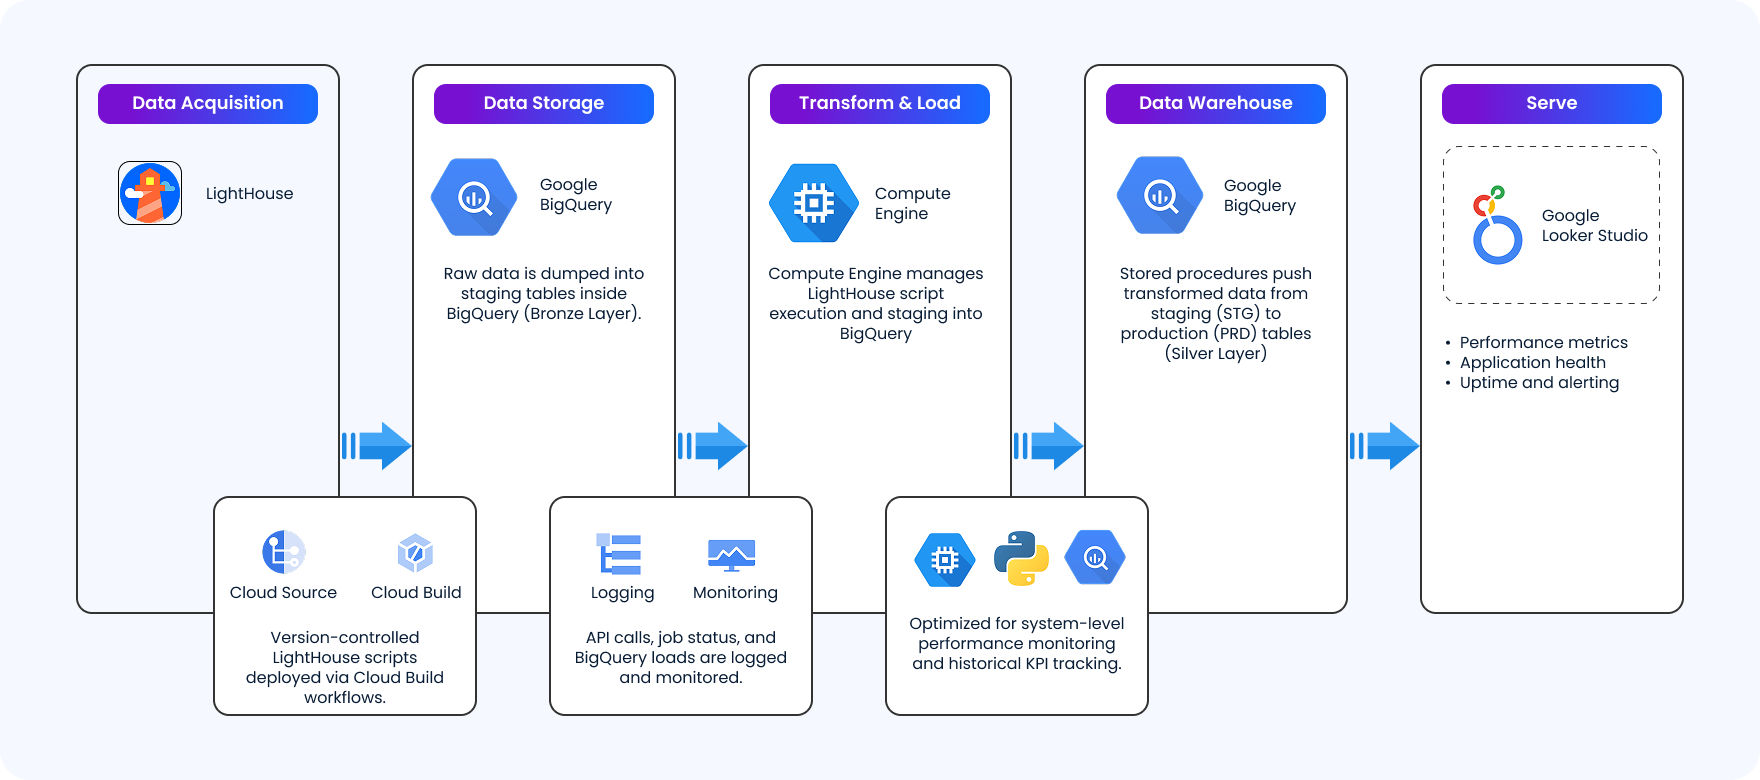
We developed robust ingestion pipelines using Compute Engine and Python to gather data from multiple sources efficiently. Automated Lighthouse reporting was integrated via APIs, enabling continuous web audits without manual intervention.
All data was centralized in BigQuery, with Cloud Functions triggering timely updates to ensure fresh analytics.
To provide accessible insights, we created dynamic Looker Studio dashboards tailored to different stakeholder needs, empowering teams with real-time visibility into web performance, operational metrics, and cost efficiency across regions.
.png)
.png)
reduction in manual data processing time through automation.

improvement in data accuracy, minimizing reporting errors.
increase in website performance insights using Lighthouse API.
decrease in operational costs enabling faster decisions.
DataRopes.ai is a global technology partner which delivers end to end services like data engineering, data analysis, data science and AI & ML
Reviewed on


150 E B St Lbby # 1810

1106 A, 11th floor, Haly Tower,
Sector R DHA Phase 2, Lahore
DataRopes.ai is a global technology partner which delivers end to end services like data engineering, data analysis, data science and AI & ML.
Reviewed on
Address
150 E B St Lbby # 1810
1106 A, 11th floor, Haly Tower,
Sector R DHA Phase 2, Lahore
© DataRopes 2025. All rights reserved


.png)

.png)